NanoVNA Saver - Part #1
Hi
As I am naturally curious about RF Tech, I tend to collect devices that quantify certain aspects of the RF hobby.
This device is, by far been the most interesting one.
Some time ago, I wrote morfeusQt, which is still somewhat active...
So I contemplated writing a similar python application for this device.
Fortunately, I was searching GitHub for "nanovna" one night and this popped up.
It was Python, and it worked on first load and omg...
It's opensource!
It is written by Rune B. Broberg / 5Q5R.
In the following blog post will go through some vigorous screenshotting and brief texting to explain my process,
please bear with me as I run through its use cases, some of which I will cover in the next article as my understanding
on the matter deepens.
The steps that follow are:
- Setup basic application
- Calibrating the device
- Measuring some filters
- Extend Range Firmware up to 1.5GHz
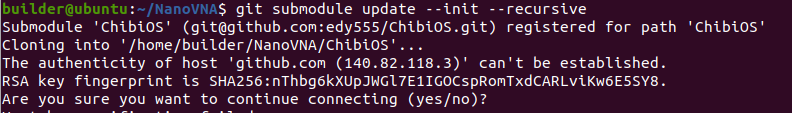
I will forego going through the software repository cloning process and jump straight to usage.
This should yield the most satisfying results from this little USB serial device.
Basic Setup
Firstly let's download the application: Please follow this link for the latest release page.
Once downloaded, let's have our nanoVNA device plugged in via the USB cable before firing up the application.
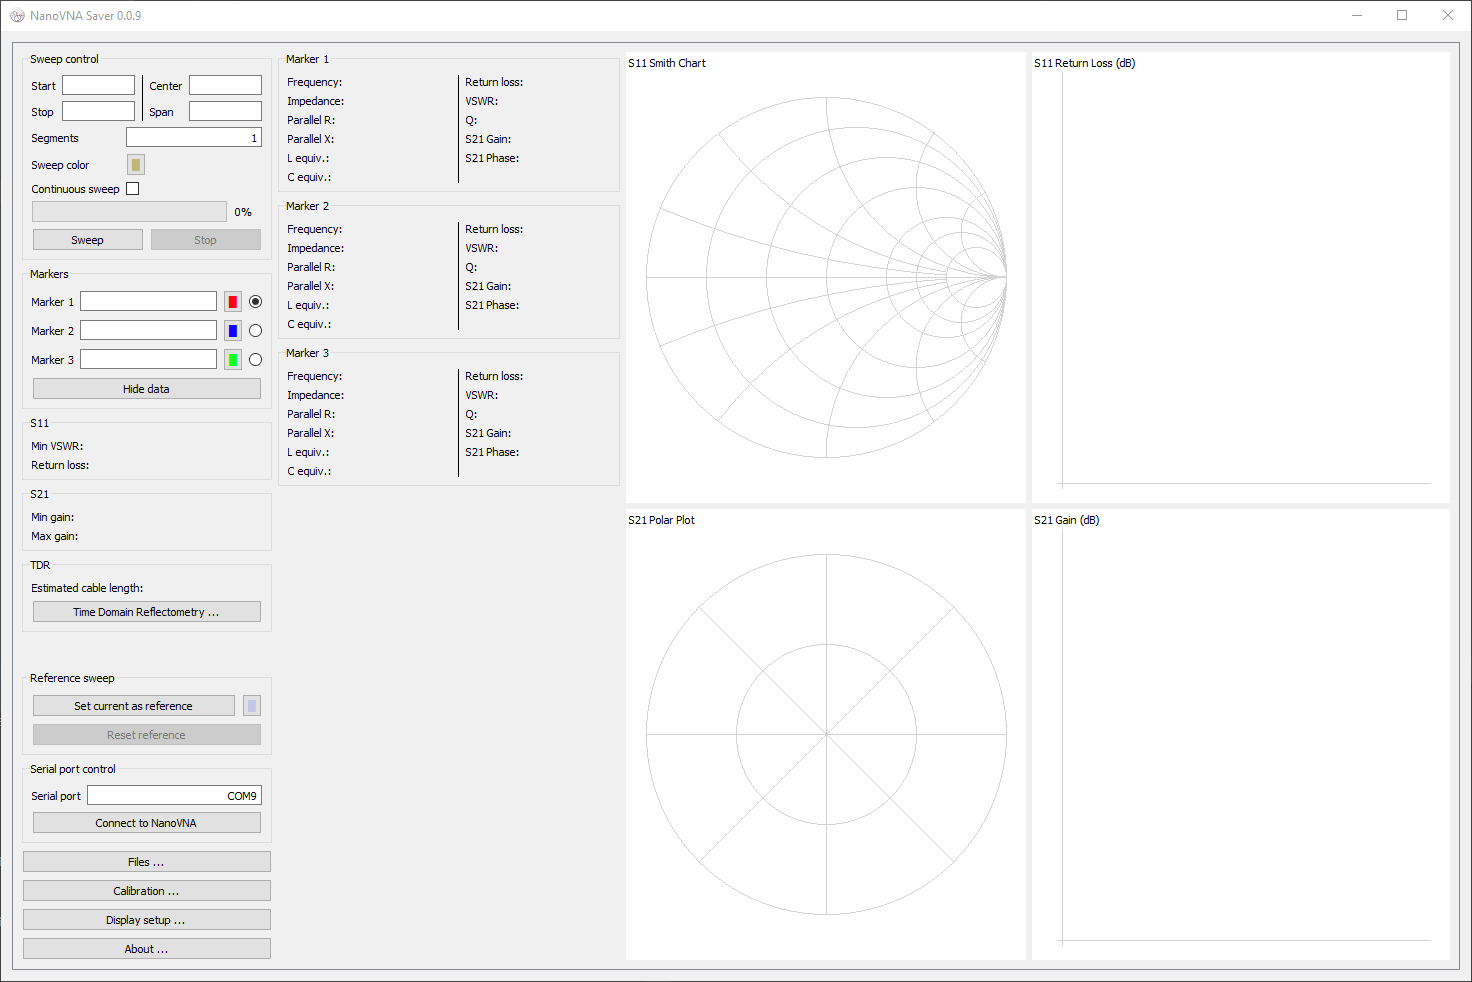
Once opened, we have a screen that looks like this.
We then click on Connect to NanoVNA to initiate our device and get the first scan.
Here we are presented with a beautiful presentation of our data.
I am going to customise this display, and I do this by clicking on Display Setup and by changing the Sweep Color.
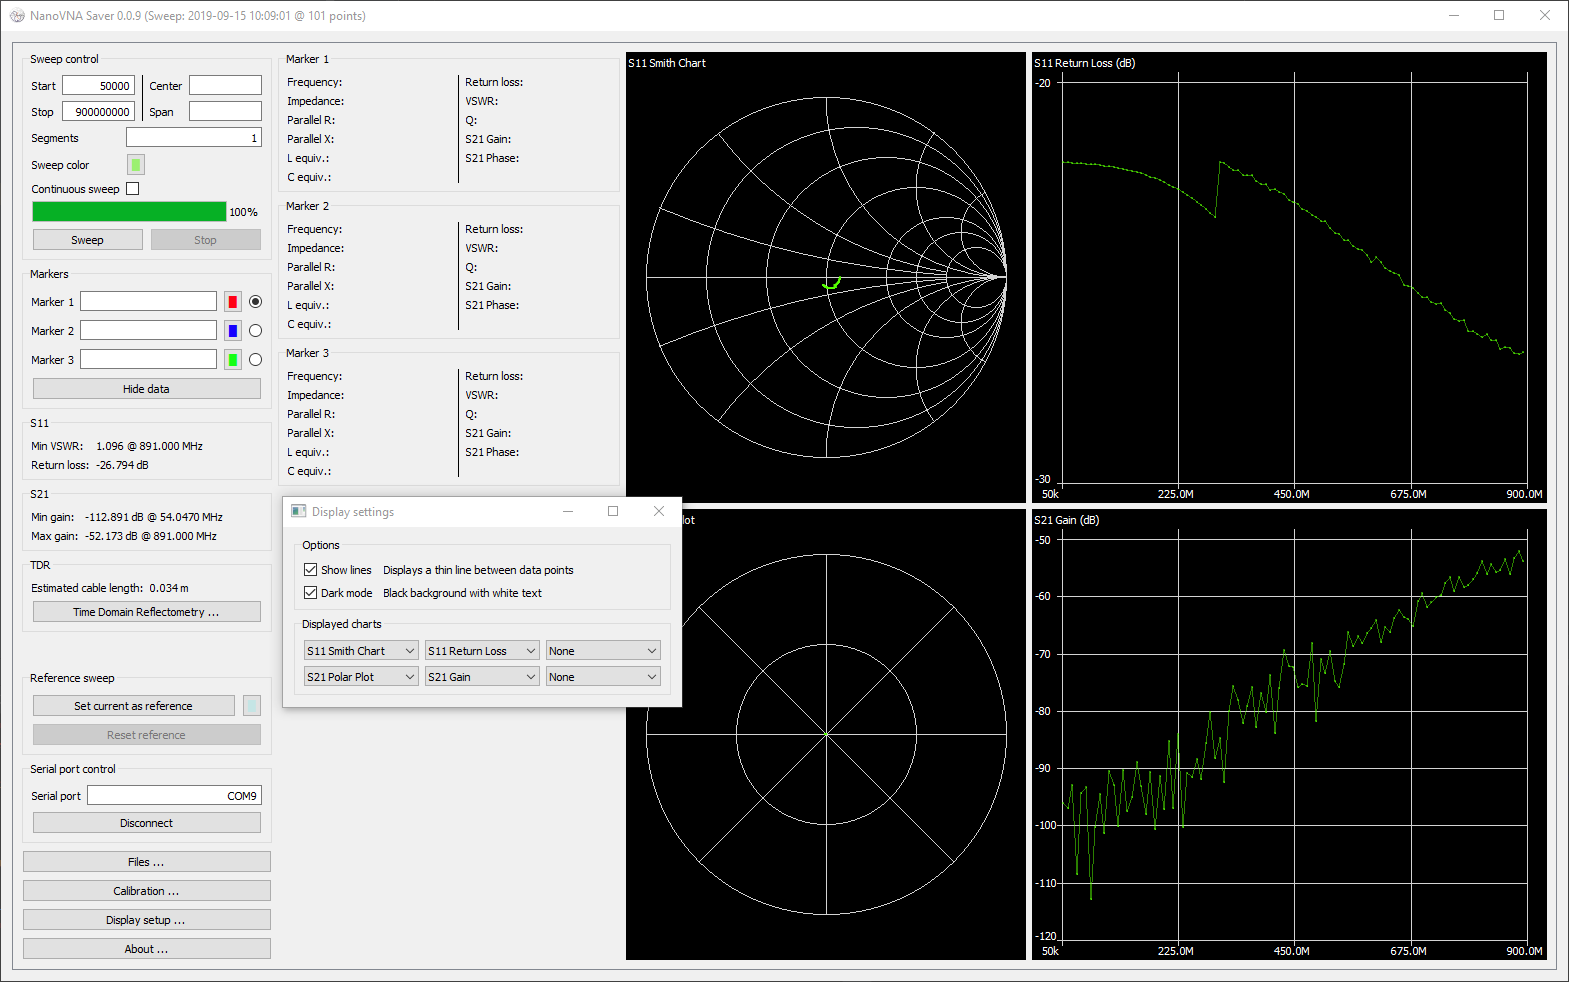
That's a little better...
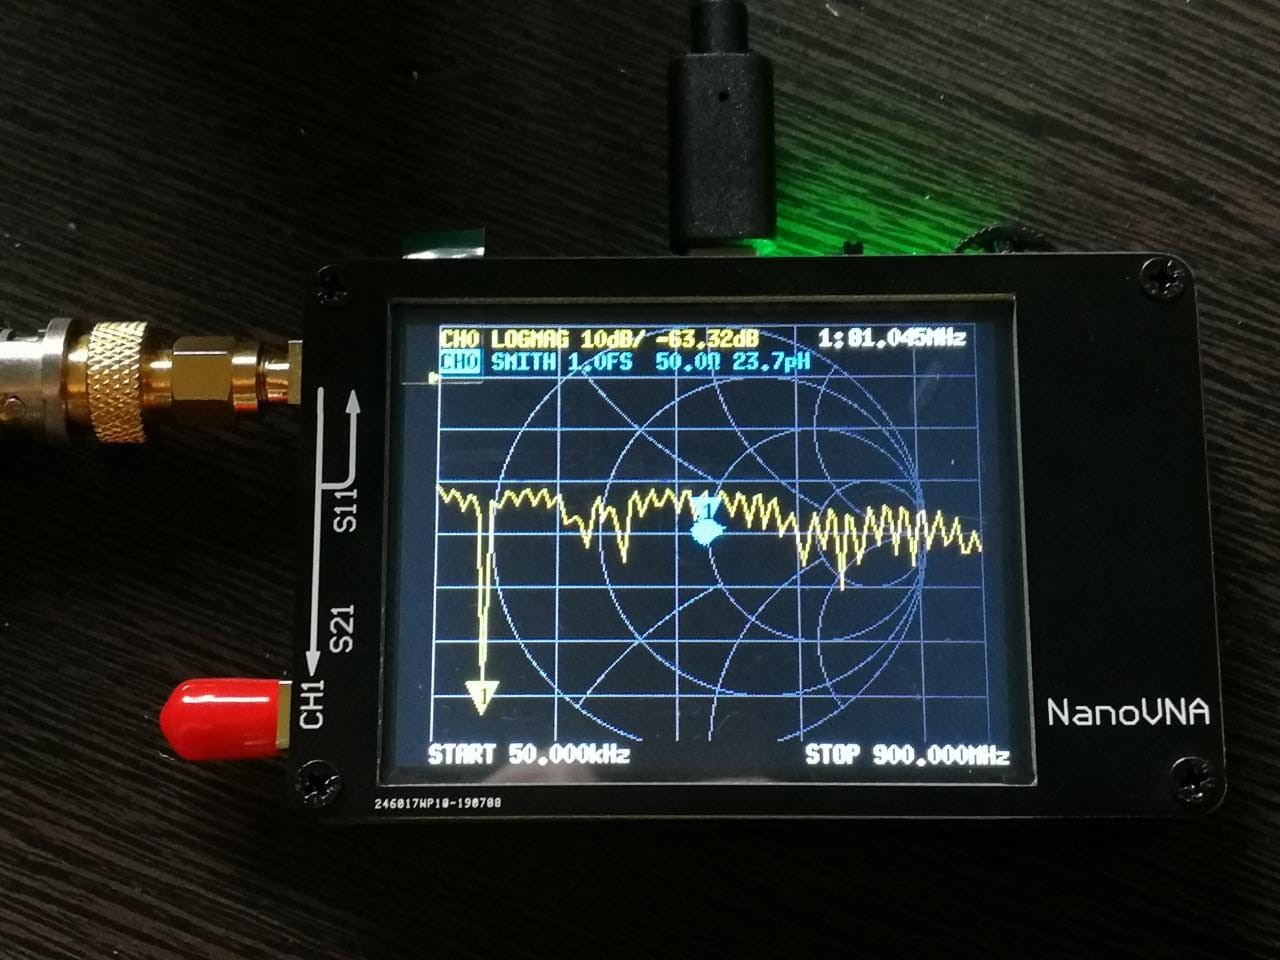
Firstly, we need to calibrate.
Short
Open
Load
Through
Isolation 2x 50Ω dummy loads
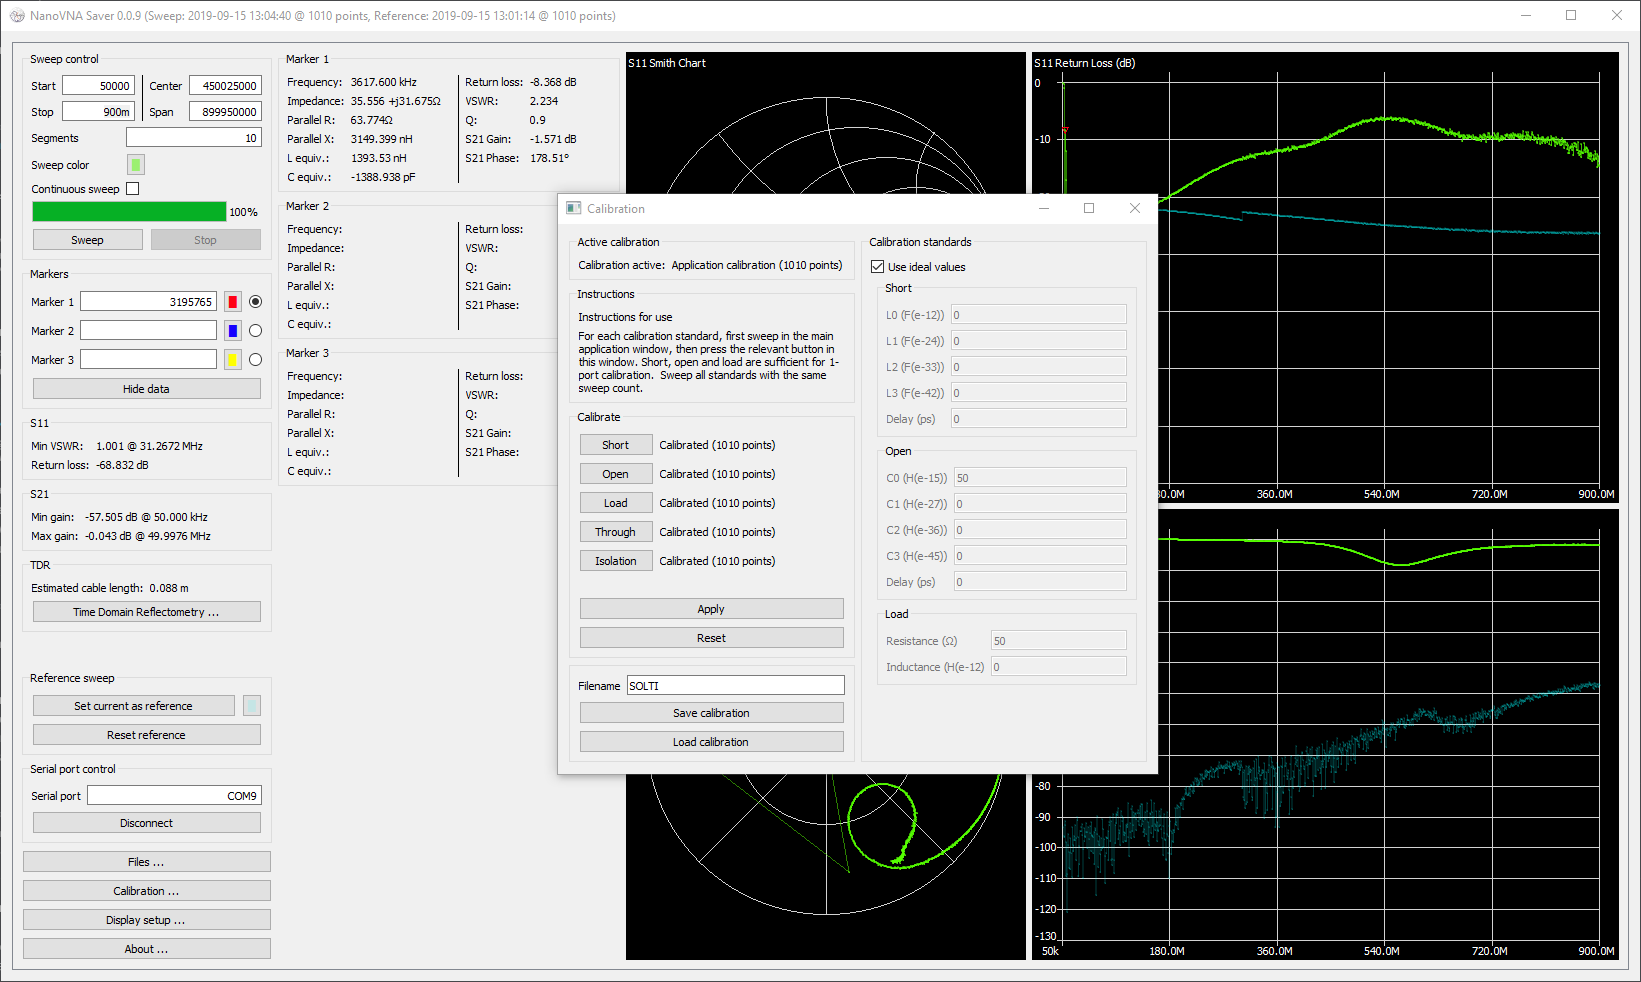
We click on calibration, and then we set our segments to 10 to have more points, after which we click sweep.
Once the sweep completes with our Short in place, we click the "short" button in the calibration screen.
We follow this process for each step (Short, Open, Load, Through and Isolation) of the calibration process. Then after the OSL calibration is complete, we can click apply and then if we'd want we can save the calibration for later loading.
We then close our calibration screen.
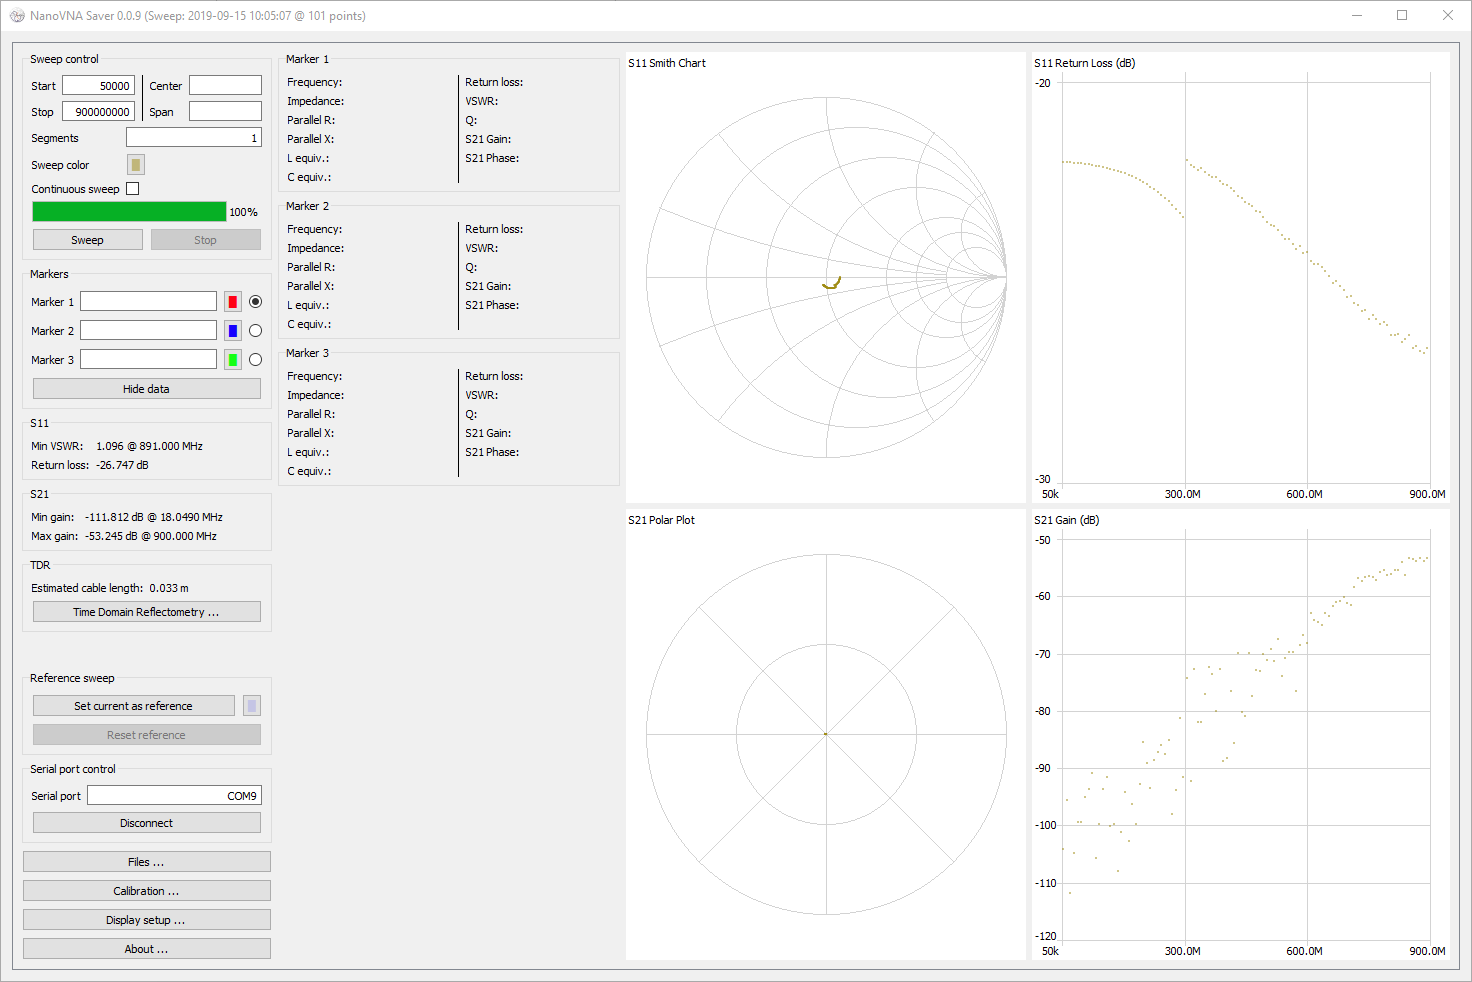
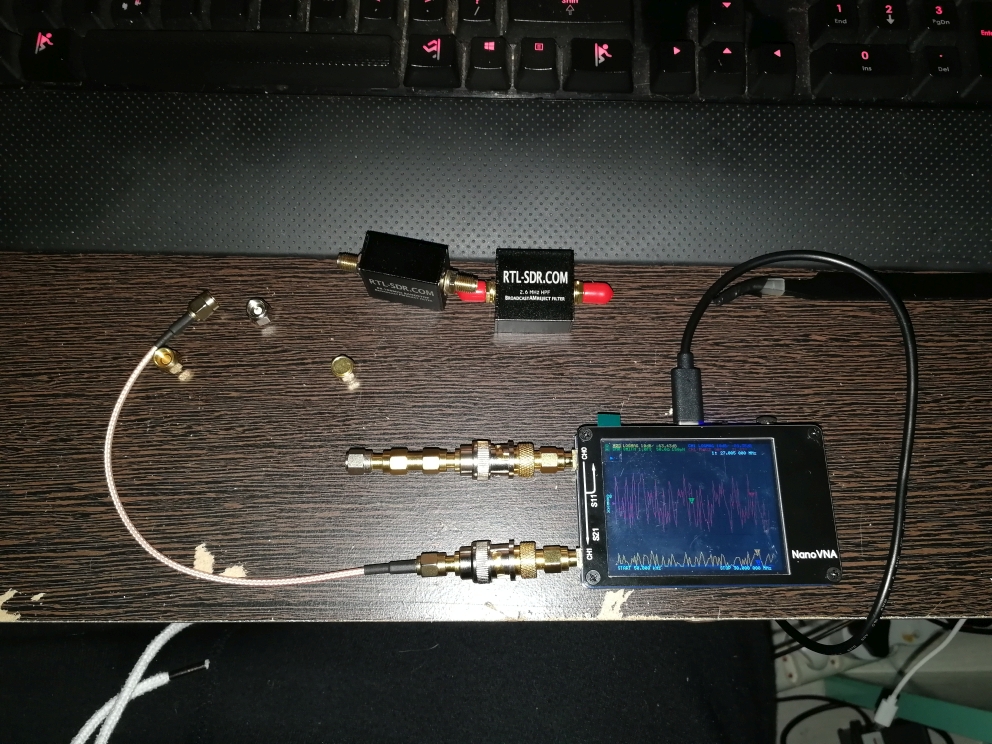
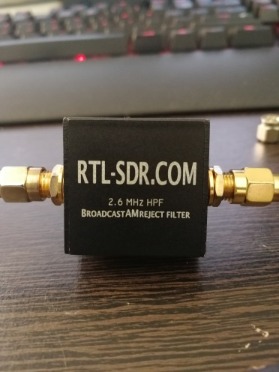
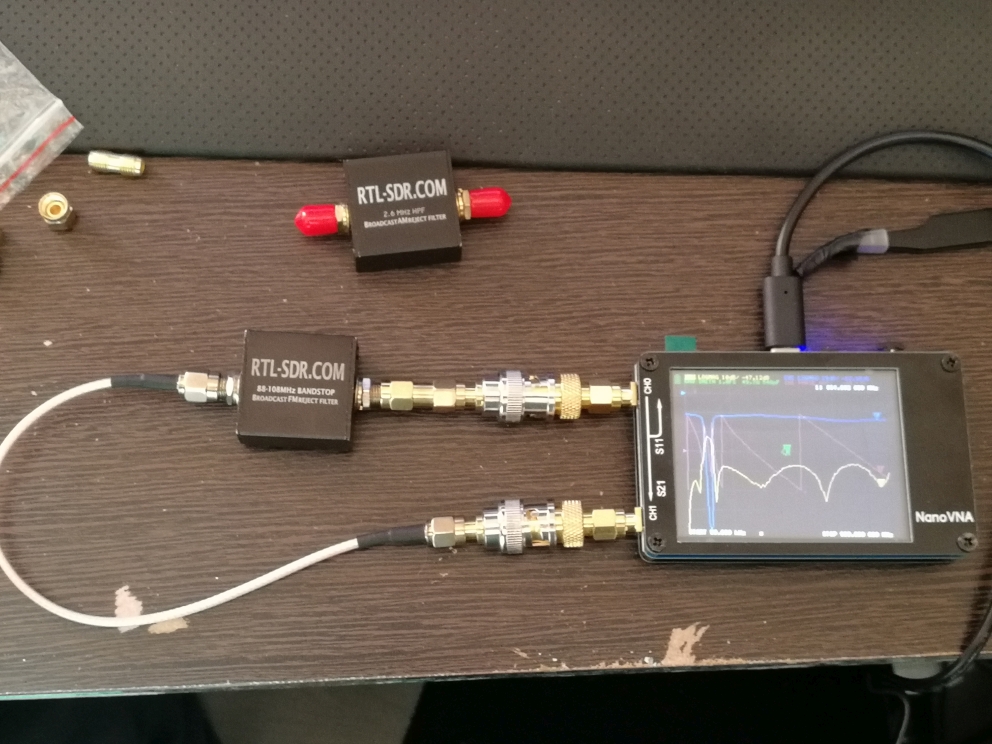
Filter #1
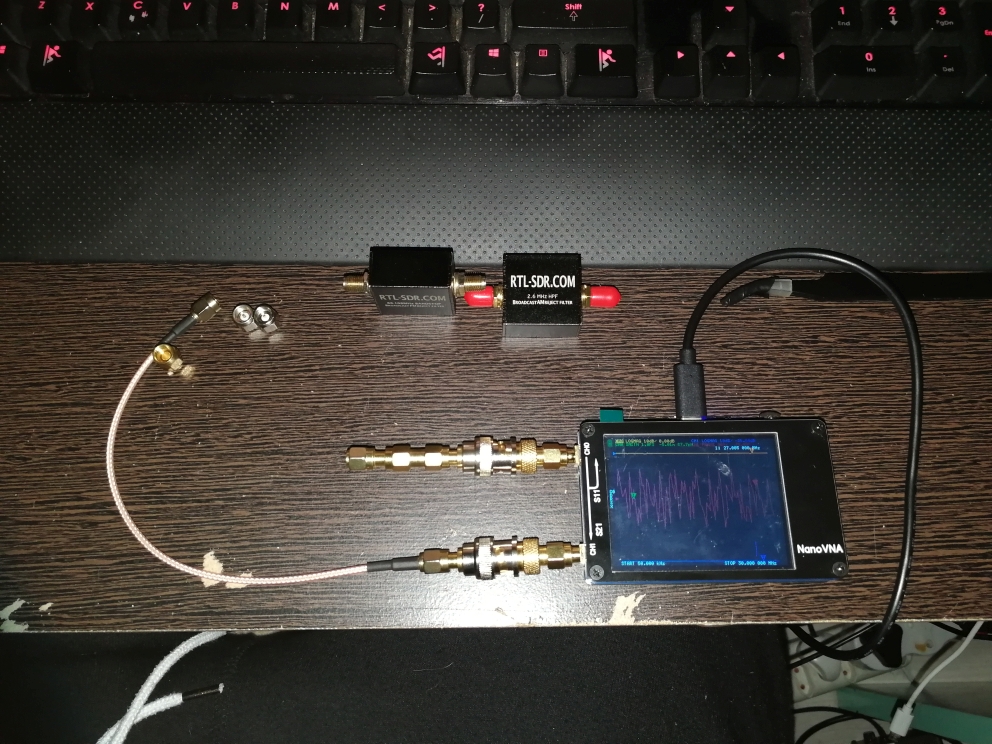
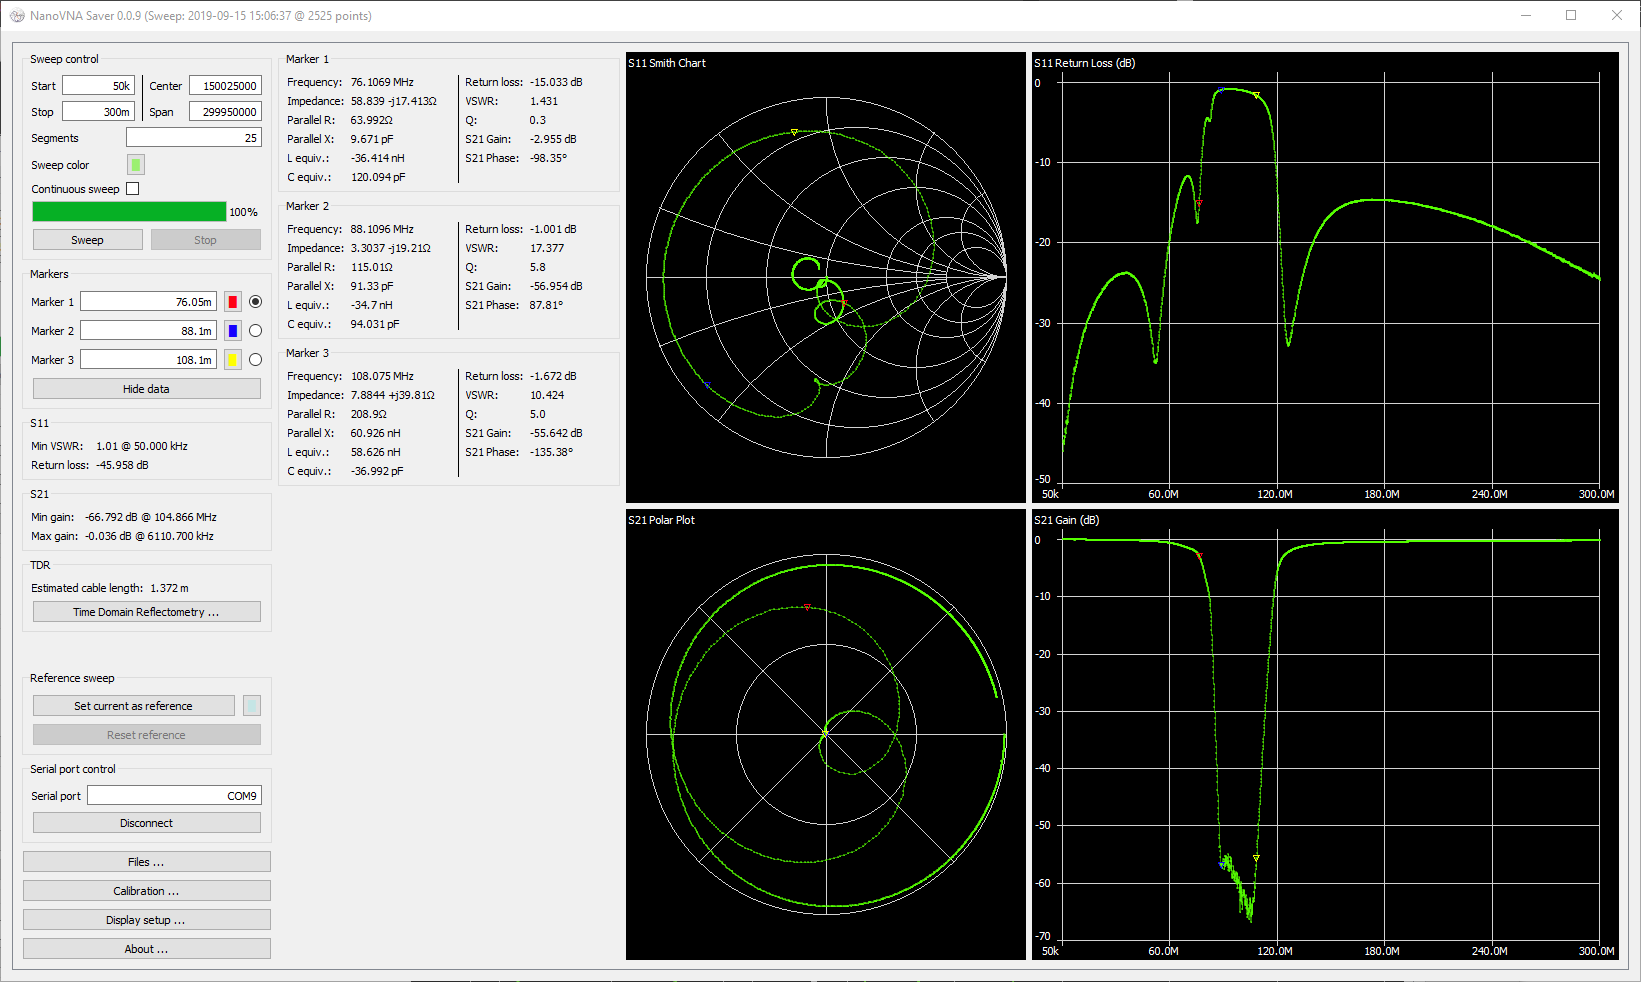
First up a 2.6MHz HPF from RTL-SDR.
 We sweep from 50KHz - 30MHz with ten segments for some excellent resolution(1010 data points)
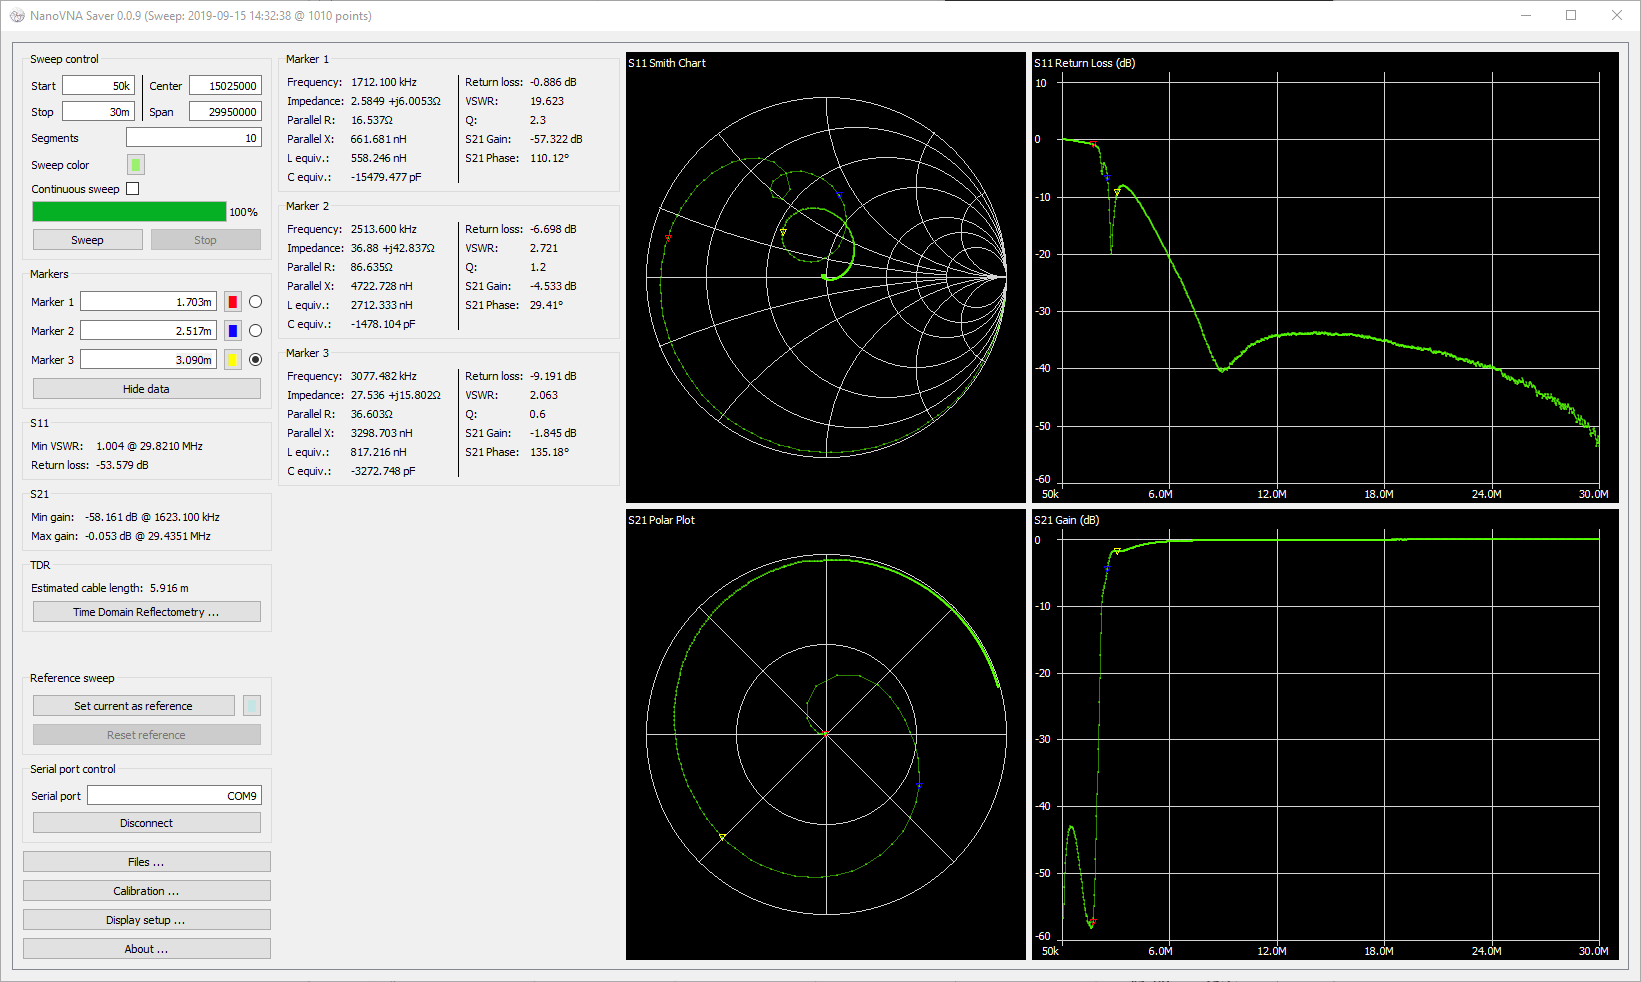
I've also added three markers to peak at values, to match the first markers in the chart below.
Markers points can be highlighted by selecting the appropriate radio box in the markers section.
It matches nicely with what s found on the RTL-SDR website
Return Loss

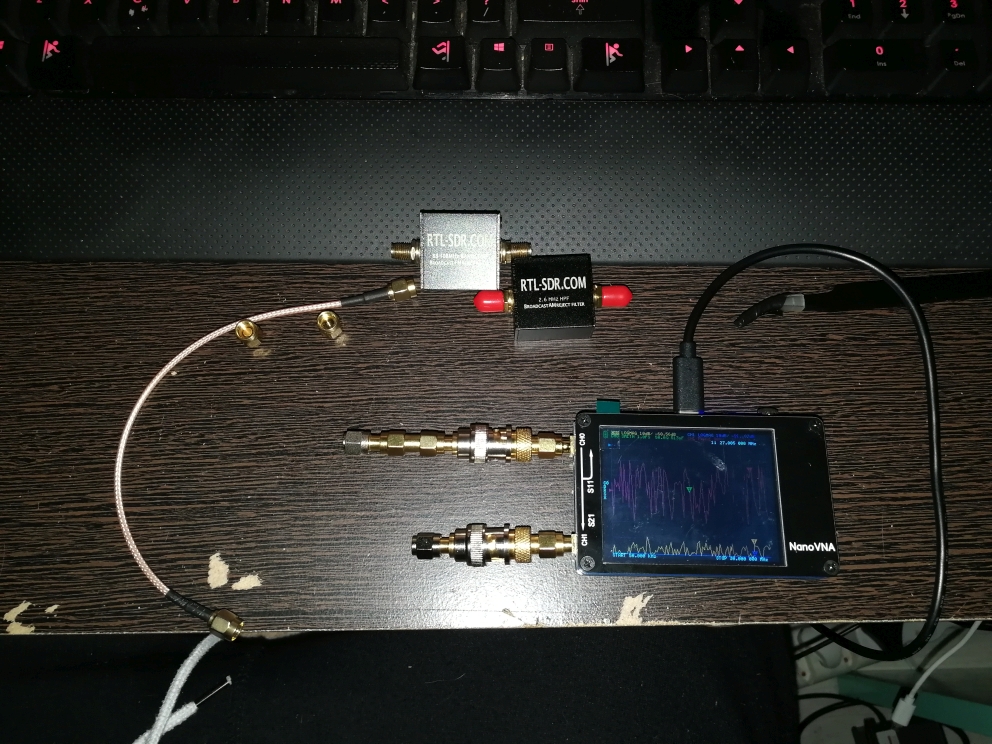
Next, we sweep from 50KHz-6MHz, for a closer look
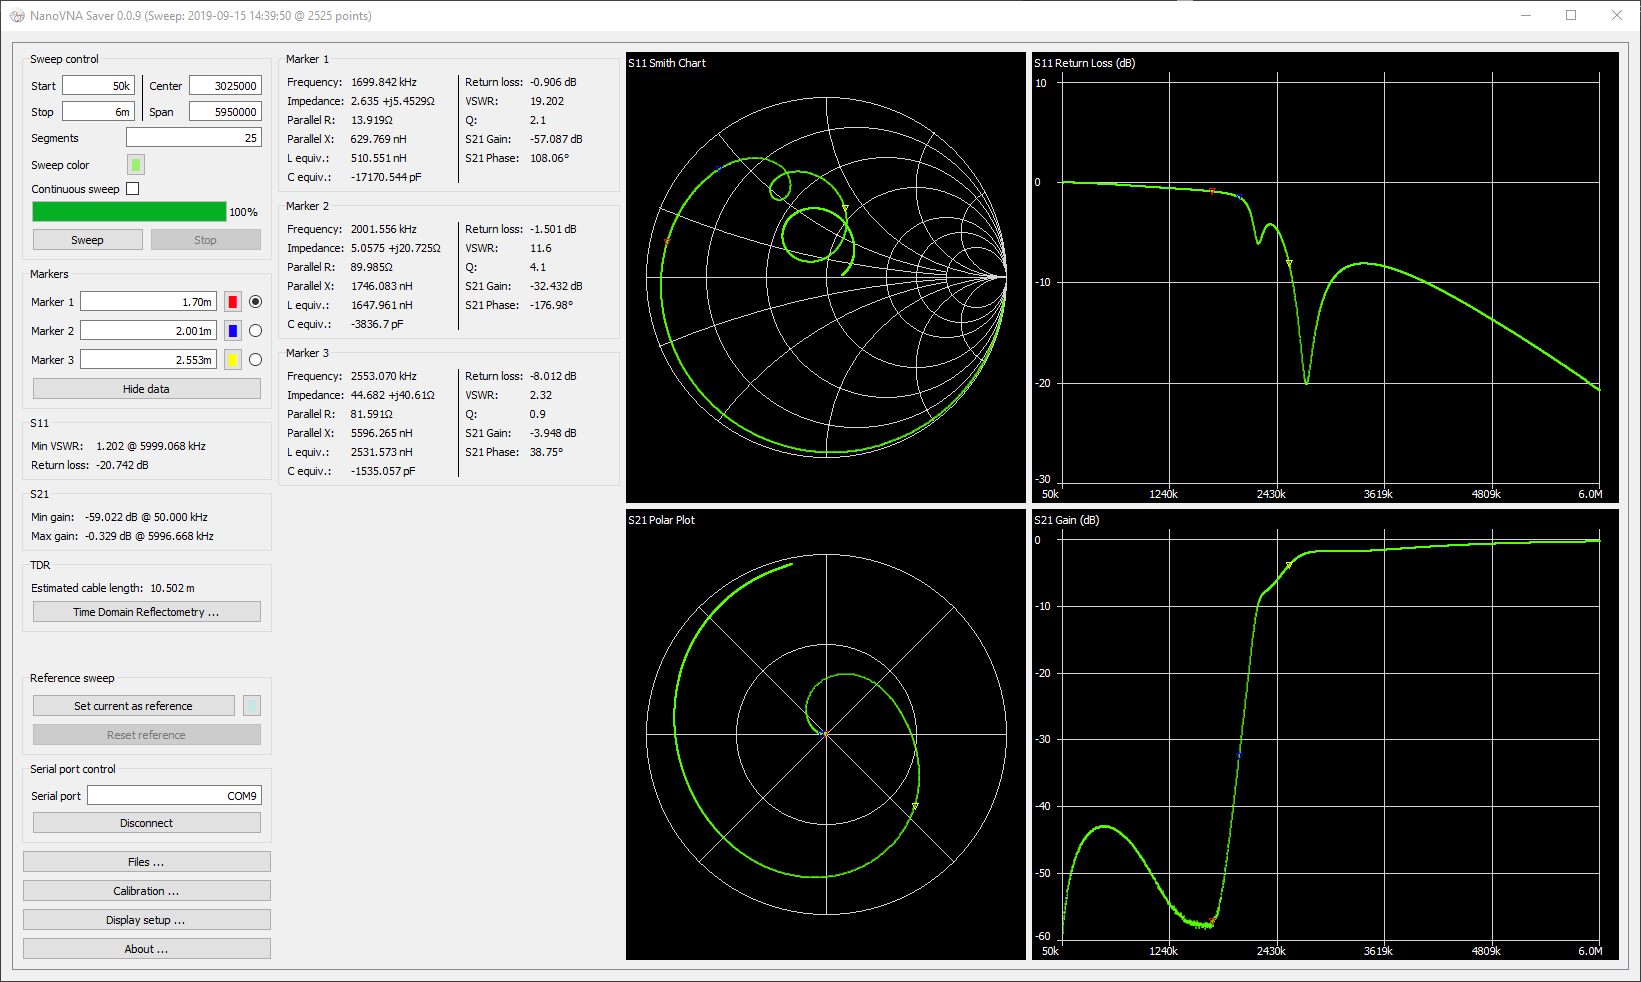

It also pairs nicely with what is on RTL-SDR
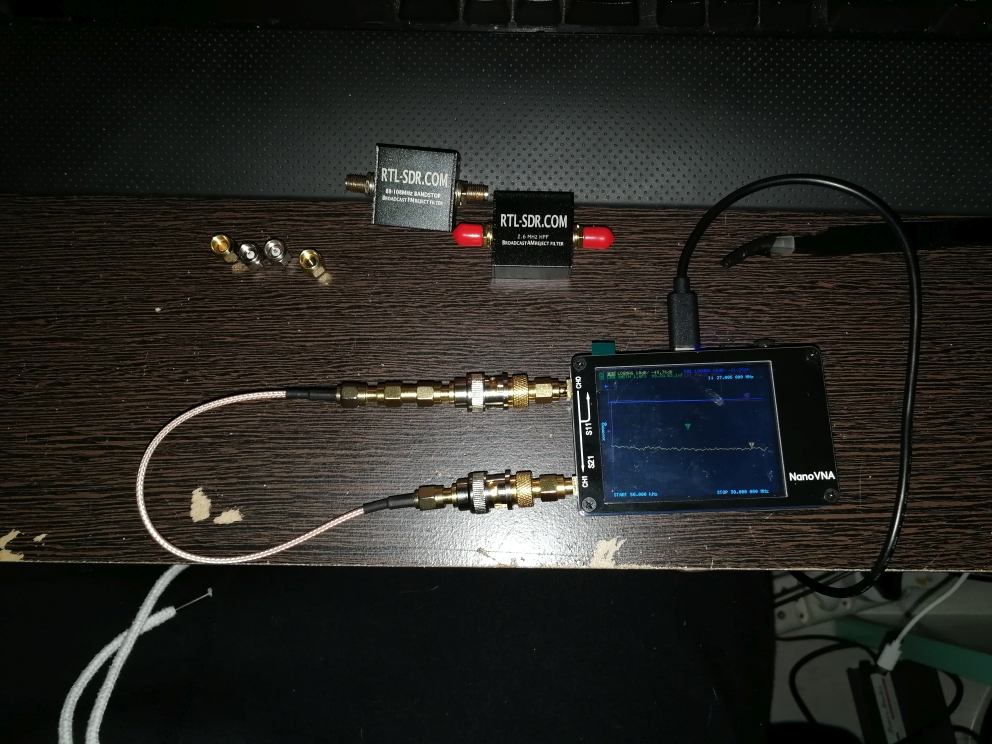
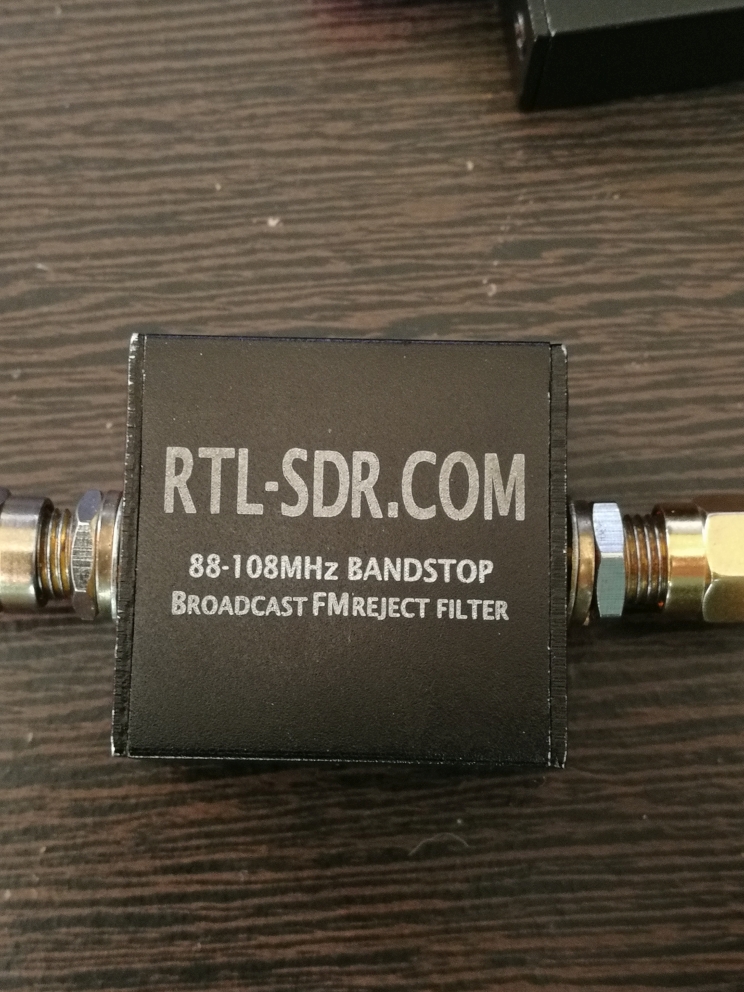
Filter #2
The 88-108MHz bandstop filter
I
We sweep from 50KHz-300MHz


Again this matches quite nicely with what is on RTL-SDR
Mods
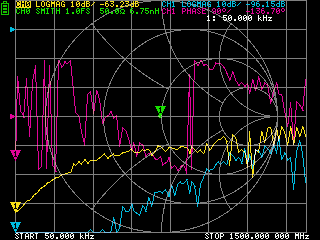
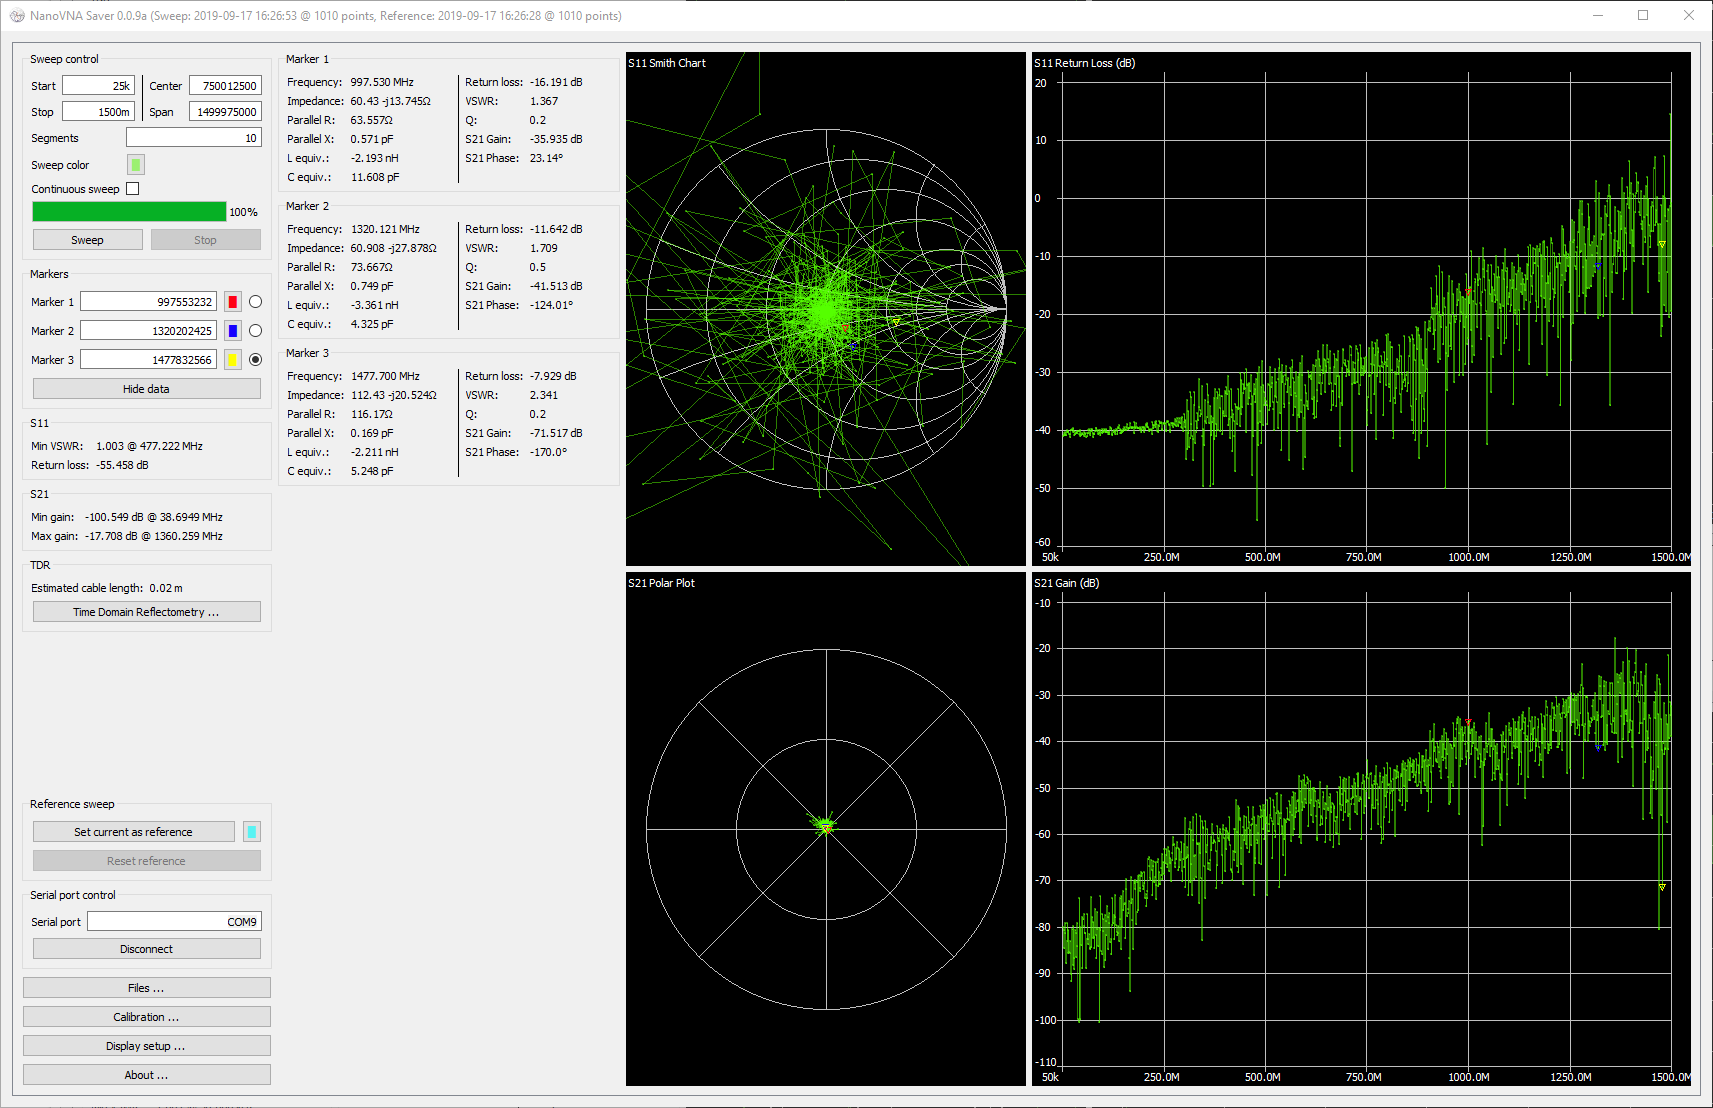
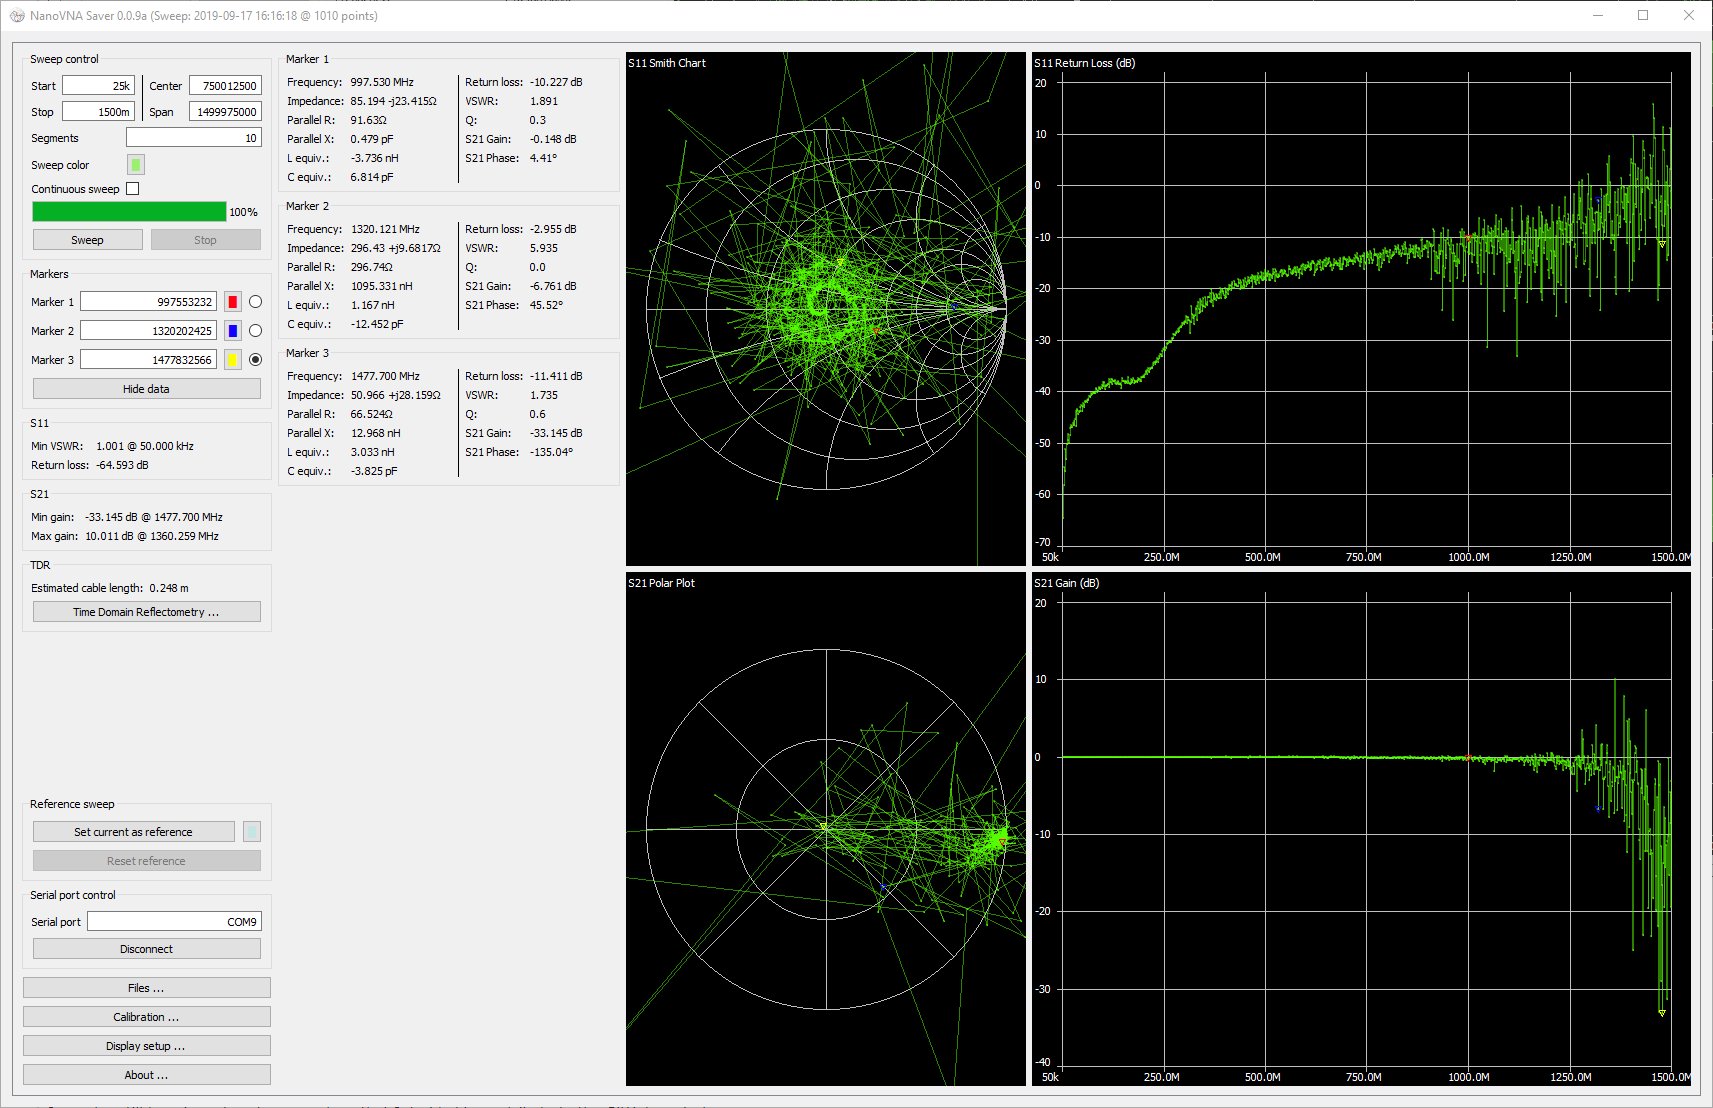
EDIT 17-09-2019 Here I tested a new master branch firmware update which expands the frequency range by 600MHz to 1.5GHz.
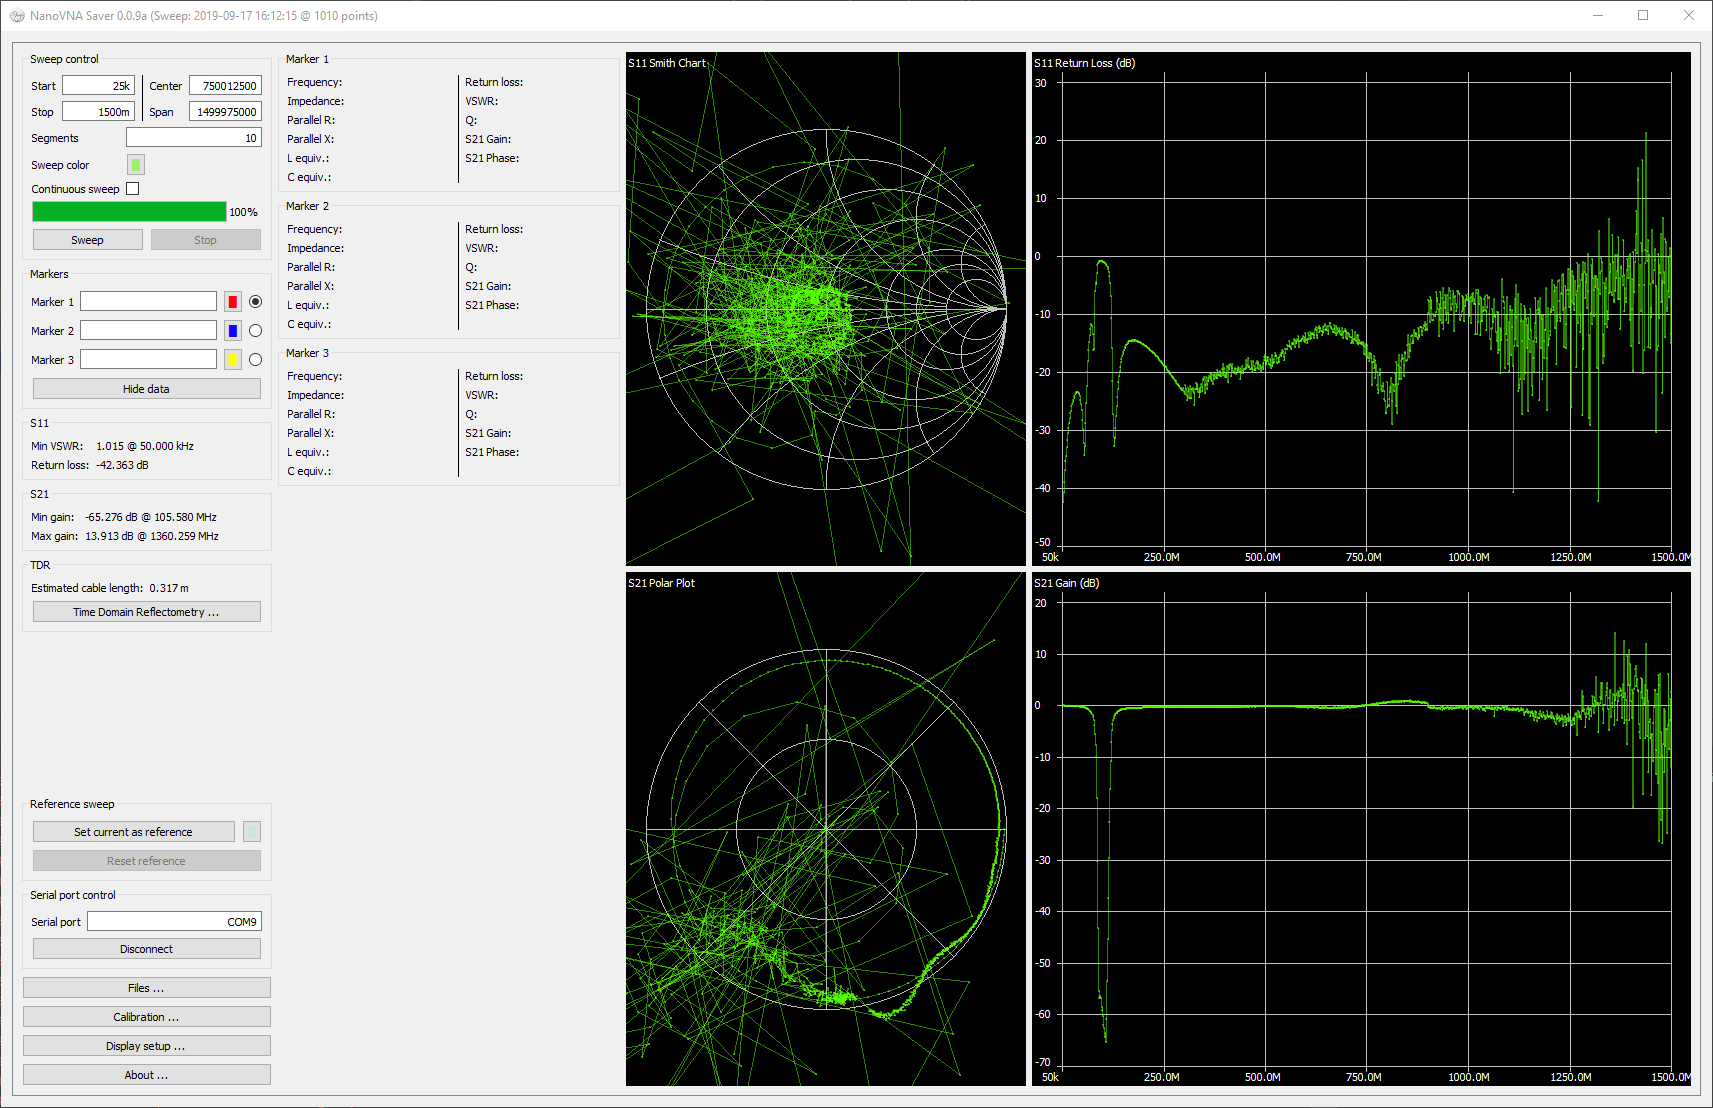
Here are some device captures with a 50Ω load
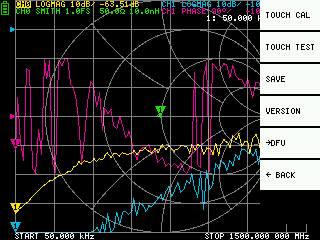
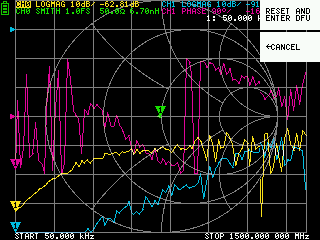
DFU can be entered via software switch
As can be seen below, the hardware limitations of the device are being met above 900MHz.
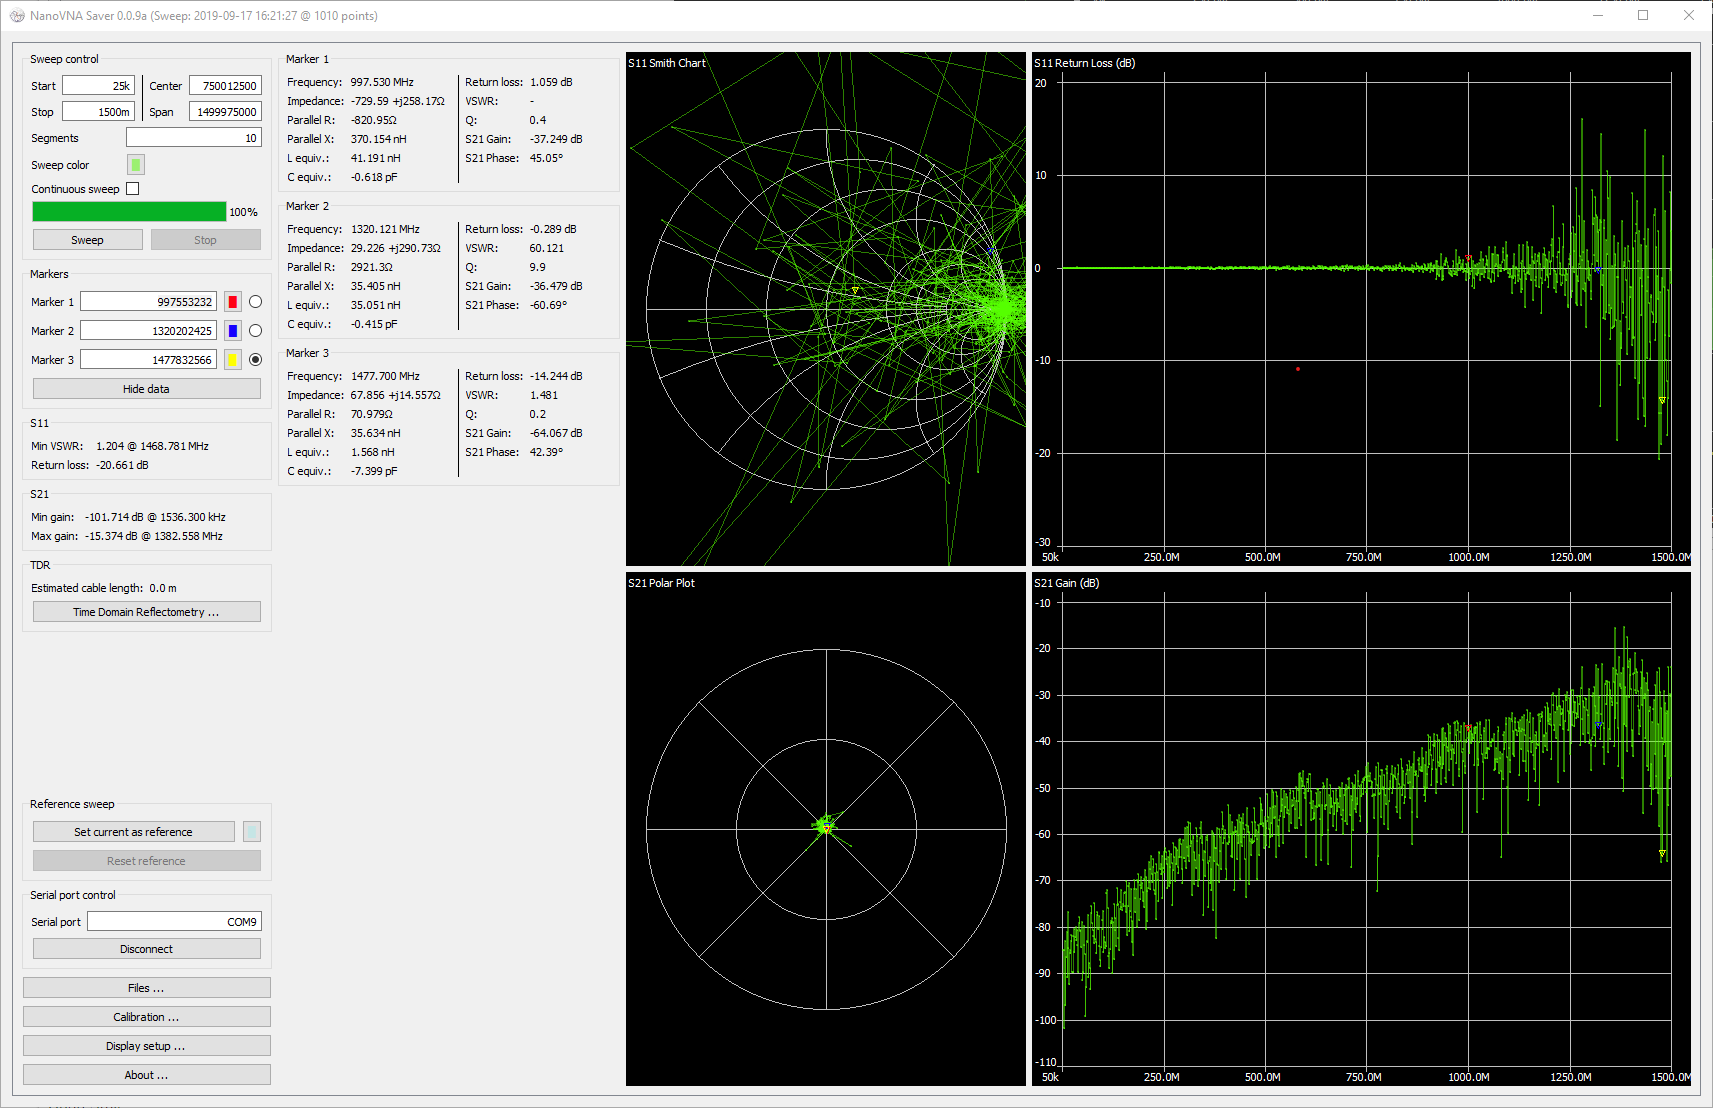
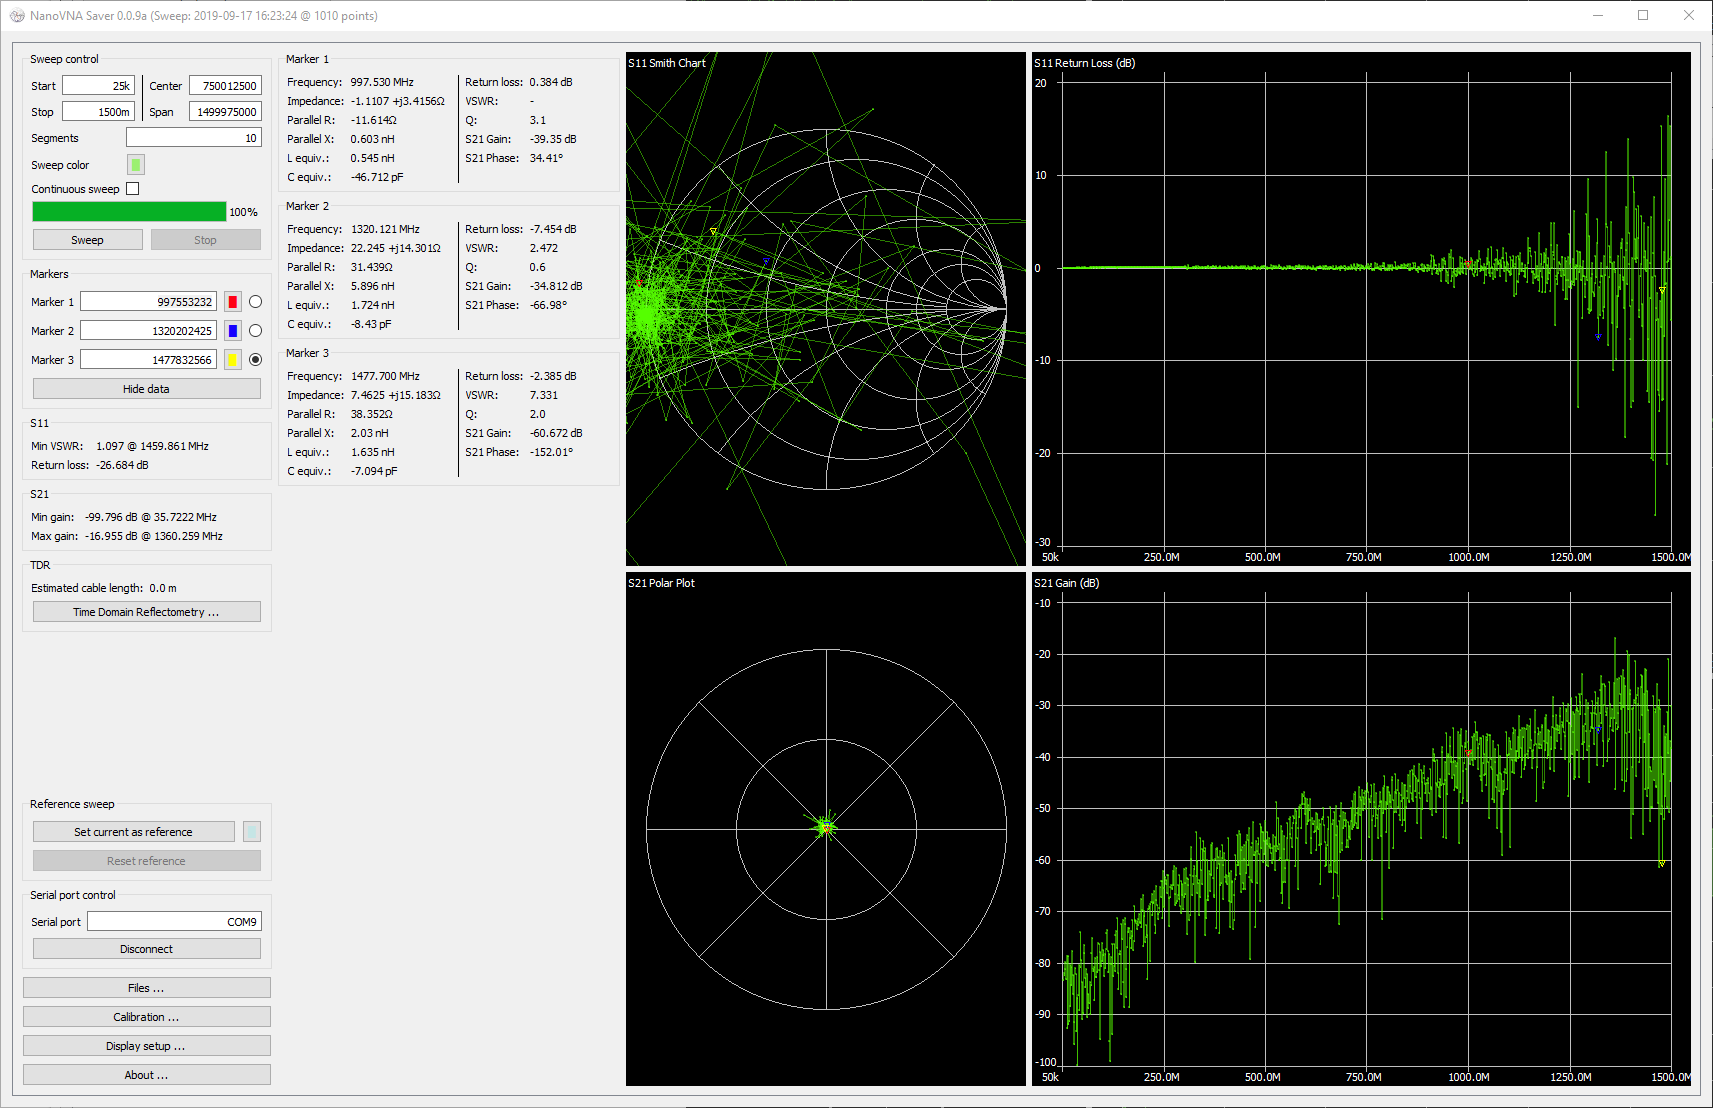
This is a sweep of the bandstop filter in place with a new calibration made for the new range in the latest firmware.
Here is the Open sweep with extended range
Here is the Short sweep with extended range
Here is the Load sweep with extended range
Here is the through sweep with extended range
Perhaps the device would need a hardware upgrade shortly?
Just for science, how would it look with 10k points?
A sweep of 10100 points with the bandstop in place
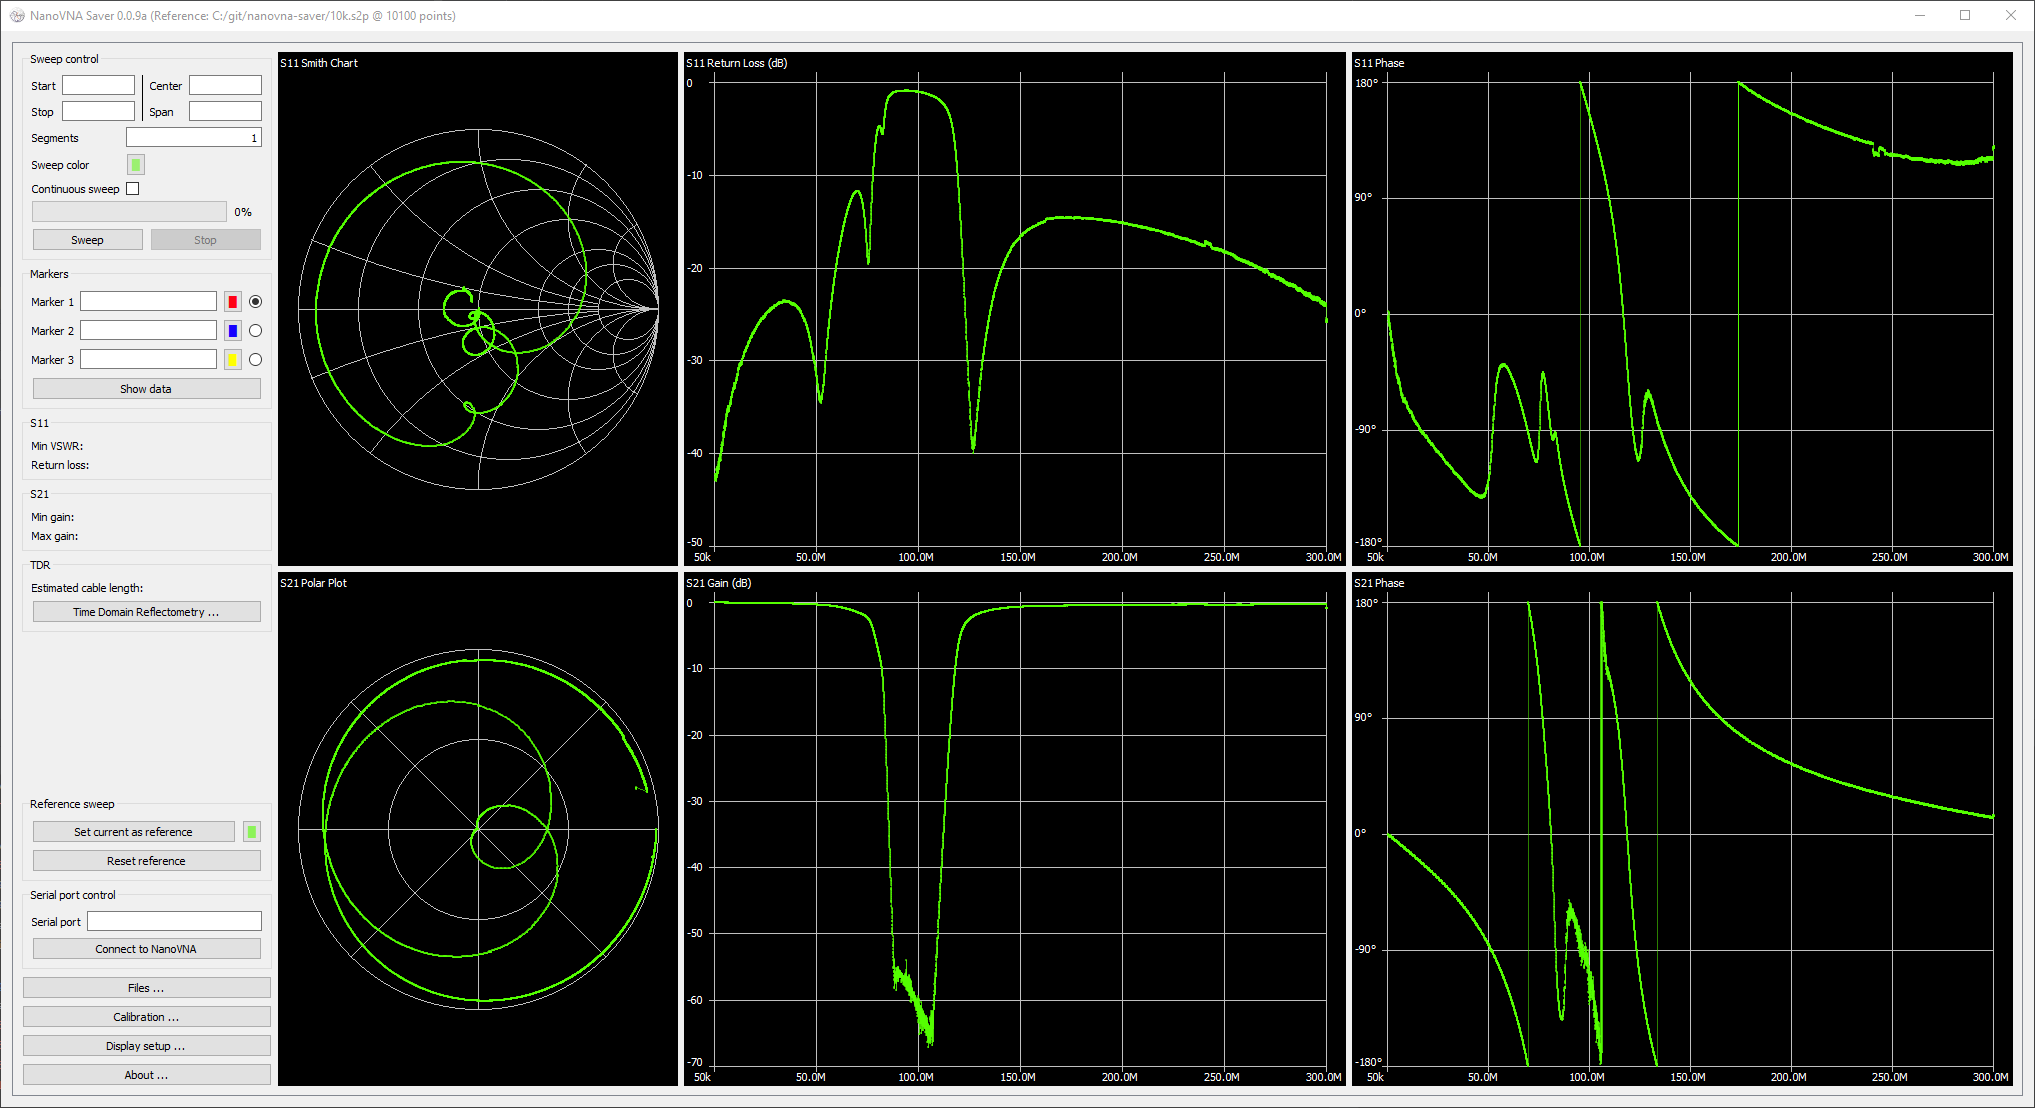
:)
Conclusion
So for me being a radio amateur and loving building things, it's nice having a device that can quantify specific theoretical parameters.
I am also still learning a bunch, so much so that I decided to contribute to the GitHub project.
It is lovely to see the application grow with every iteration and Rune is definitely on the fast track to making
one of the most top-notch VNA applications for this device.
I would also like to thank the author of this article and Rune for pointing it out, it always great learner things from others in the same domain.
I'll get to measuring some antennas on the next Part, for now, if you'd be interested here
are some build instructions for the firmware in Ubuntu 19.04
Kind Regards
Ohan Smit
ZS1SCI